Two luminaires can produce exactly the same number of lumens and still create completely different lighting results.
One may spread light broadly across a room, while the other concentrates it into a narrow beam that reaches a display, work surface or distant object with far greater intensity. The total light output is the same, but the direction of the light and the amount that reaches the target are not.
This is why a lighting specification cannot rely on wattage or lumens alone.
Lumens, candela and lux describe three connected stages of the same lighting journey: how much visible light a luminaire produces, how strongly it sends that light in a particular direction and how much light finally arrives at a surface. Understanding the difference helps designers, engineers, facilities teams and customers compare products correctly and create lighting that performs as intended.
Lumens describe total output. Candela describes direction. Lux describes the result on the task surface.
Three measurements, three different questions
The simplest way to separate these terms is to ask what each one measures:
- Lumens (lm): How much visible light does the source or luminaire emit in total?
- Candela (cd): How intense is the light in a particular direction?
- Lux (lx): How much light reaches a surface at a specific point?
Lumens describe output. Candela describes direction. Lux describes the result at the task plane.
These measurements are related, but they are not interchangeable. A higher value in one unit does not automatically mean a better lighting solution.
 Figure 2. Lumens describe total output, candela describes directional intensity and lux describes light arriving at a surface.
Lumens: the total quantity of visible light
Lumens measure luminous flux – the total quantity of visible light emitted by a source or luminaire.
This makes lumens useful when comparing the overall output of products intended for a similar purpose. If two general-lighting luminaires have comparable optics and installation conditions, the higher-lumen option will normally deliver more light into the space.
However, a lumen rating does not explain where that light goes.
A 3,000-lumen floodlight can distribute its output over a wide area. A 3,000-lumen spotlight can concentrate much of the same output into a tight beam. The two products may have the same lumen value but create very different intensities, coverage patterns and lux levels.
Product lumens matter more than LED-package lumens
When reviewing technical data, check whether the stated value refers to the complete luminaire or only to the LED light source.
Light is lost through lenses, diffusers, reflectors, covers and thermal or electrical conditions. Luminaire lumens, measured for the complete product, provide a more meaningful comparison than the theoretical output of the LED packages before these system losses.
It is also important to distinguish initial output from maintained output. LED output changes over time and with operating temperature. A complete design should consider lumen maintenance, ambient conditions, driver performance and the expected maintenance cycle.
Watts are not a measure of light output
Watts measure electrical power, not brightness.
Modern luminaires can produce different lumen outputs from the same wattage because LED efficacy, driver efficiency, thermal management and optical design vary. The useful efficiency comparison is usually luminous efficacy, expressed in lumens per watt (lm/W), but even a high lm/W value does not prove that the light is being delivered to the right place.
Candela: the intensity of light in a direction
The candela is the unit of luminous intensity in a specified direction.
The relationship is expressed as:
1 candela = 1 lumen per steradian
A steradian is the unit used to describe a solid angle. In practical terms, candela values tell us how strongly a luminaire concentrates its light within a direction or beam.
This is why candela values are particularly important for:
- Spotlights and accent lighting
- Retail displays and merchandise
- Restaurant tables and feature lighting
- Stage and event lighting
- High-bay and long-throw applications
- Floodlights, street lighting and security lighting
- Transport, signalling and specialist directional optics
A narrow optic generally produces a higher peak candela because it directs light into a smaller angular area. A wide optic spreads the light across a larger field and normally produces lower intensity at any one point.
High candela values do not necessarily mean high lumens
A lower-lumen spotlight can produce a higher intensity on a distant target than a higher-lumen floodlight if the spotlight has a much narrower beam.
This is the distinction between quantity and concentration. Lumens tell us how much light is available; candela values tell us how strongly that light is projected in a direction.
Product data may state peak candela or centre-beam candlepower. A polar intensity curve or a digital photometric file provides a far more complete view because it shows how intensity changes across different angles rather than reporting only the highest value.
Lux: the light arriving at a surface
Lux is the unit of illuminance – the luminous flux incident on a surface per unit area.
The basic relationship is:
1 lux = 1 lumen per square metre
Illuminance measured in lux is therefore central to lighting design because it describes the light available where people actually need to see: on a desk, production line, warehouse floor, retail display, staircase, sports surface or vertical face.
The same luminaire can create very different lux levels depending on:
- Mounting height and distance from the target
- Beam angle and optical distribution
- Luminaire aiming and angle of incidence
- Spacing between fittings
- The size and orientation of the calculation surface
- Room geometry and surface reflectance
- Obstructions, dirt and lumen depreciation
- Contributions from other luminaires and daylight
For a perfectly uniform distribution across a defined surface, average illuminance can be simplified as:
Average lux = luminous flux arriving at the s
at the surface / area
This is not a reliable method for calculating the total output of a real luminaire from one lux-meter reading. Actual beams are not perfectly uniform, some light falls outside the measured area and reflections or other sources may contribute to the reading. Proper lumen measurement requires suitable photometric equipment or spatial integration.
Average lux is only part of the result
A design can meet an average illuminance target and still perform poorly.
Dark patches, excessive contrast and glare can affect comfort, safety and task visibility even when the calculated average looks acceptable. Depending on the application, a complete assessment may also consider minimum illuminance, maximum illuminance, uniformity, glare, vertical illuminance and the relevant calculation grid.
From source to surface: how the units connect
Think of the relationship as a three-stage flow:
- A luminaire produces a total amount of visible light, measured in lumens.
- Its optical system distributes that light with different intensities, measured in candela by direction.
- The distributed light travels through the space and arrives at surfaces as lux.
For an ideal point source aimed perpendicular to a surface, the illuminance at the centre of the beam can be approximated by:
Lux = candela / distance squared
If the light strikes the surface at an angle, the illuminance is reduced further according to the cosine of that angle.
These equations are useful for understanding the physics, but real luminaires have non-uniform distributions, physical dimensions, spill light and optical losses. Professional designs use tested photometric data and calculation software to model the complete installation.
Beam angle: why equal lumens can create unequal results
Consider two idealised luminaires that each direct 1,000 lumens into a uniform circular beam.
A narrow 20-degree beam concentrates the light into a much smaller solid angle than a 60-degree beam. Under this simplified assumption, the narrow beam produces approximately 10,476 candela, while the wide beam produces approximately 1,188 candela.
At a distance of five metres, the corresponding on-axis illuminance would be approximately 419 lux for the narrow beam and 48 lux for the wide beam.
The total lumens have not changed. What changes is the concentration of the light and the area over which it is distributed.
This example is conceptual. Real beam angles are normally defined from measured intensity data, light is not distributed uniformly inside the beam and some output may fall outside the nominal beam angle. The correct product comparison should always use the manufacturer’s photometric data.
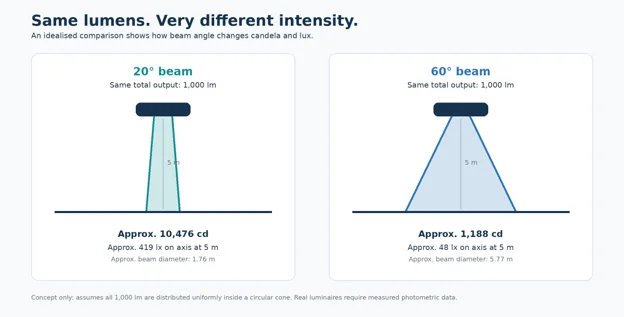 Figure 3. Conceptual uniform-cone comparison: the same 1,000 lumens create far higher candela and on-axis lux in a 20-degree beam than in a 60-degree beam.
Distance: why lux falls so quickly
For a point source, illuminance follows the inverse-square relationship.
If the distance from the source doubles, the illuminance on the target falls to one quarter. If the distance triples, it falls to one ninth.
For example, a direction with an intensity of 4,000 candela would produce approximately:
- 1,000 lux at 2 metres
- 250 lux at 4 metres
- 111 lux at 6 metres
- 5 lux at 8 metres
This explains why mounting height is a critical design input. Increasing the height may improve coverage and uniformity, but it also reduces the illuminance delivered by each fitting unless the optical distribution and output are adjusted.
The inverse-square law is an approximation for a point source in free space. At very close distances, with large luminaires, indirect light or complex optics, detailed photometric calculation is more appropriate.
 Figure 4. For an ideal 4,000-candela point source, on-axis illuminance falls from 1,000 lux at 2 metres to 62.5 lux at 8 metres.
Why a lumen-only specification can fail
Selecting a fitting only by its lumen output can lead to over-lighting, under-lighting, glare, dark areas or wasted energy.
A robust specification must also consider:
- Optical distribution: Is the beam narrow, wide, asymmetric, batwing or diffuse?
- Mounting geometry: At what height, spacing and angle will the luminaires be installed?
- Target plane: Is the important surface horizontal, vertical, sloped or three-dimensional?
- Uniformity: Is the light distributed consistently across the working area?
- Glare control: Can the source or bright optical surfaces be seen from normal viewing positions?
- Reflectance: How will ceilings, walls, floors, shelving and equipment redirect light?
- Maintenance: How will output change with age, temperature, dirt and cleaning intervals?
- Light quality: Are colour temperature, colour rendering, flicker and visual comfort appropriate for the task?
The best luminaire is not simply the one with the most lumens. It is the one that delivers the required light, in the required direction, onto the required surfaces, with appropriate comfort and efficiency.
A practical guide to the metric that matters most
| Application | Begin with | Also verify |
| Offices, classrooms and general workplaces | Lux on the defined task plane | Uniformity, glare, controls, colour quality, flicker and applicable standards |
| Warehouses and industrial facilities | Lux at floor, workbench and other critical planes | Mounting height, aisle geometry, vertical visibility, uniformity, obstructions and emergency lighting |
| Retail and showrooms | Lumens for ambient output, candela for accents and lux on merchandise | Beam control, aiming, contrast, colour rendering, CCT, glare and flexibility |
| Hospitality and restaurants | Candela and beam angle for tables or features, lux for circulation | Dimming, visual comfort, atmosphere, colour quality and spill light |
| Outdoor, area and security lighting | Candela distribution and horizontal or vertical lux at the target | Uniformity, glare, obtrusive light, mounting, aiming and environmental conditions |
| Transport and specialist applications | Application-specific intensity and illuminance requirements | Viewing direction, uniformity, glare, redundancy, controls and governing standards |
These are starting points rather than universal specifications. The required criteria and values depend on the visual task, project brief, risk profile and applicable standards.
How designers use photometric data
Professional lighting calculations do not guess the relationship between lumens and lux. They use measured luminaire data.
An IES or LDT photometric file describes how a fitting distributes luminous intensity in different directions. Lighting-design software places this tested distribution into a model of the actual project, including mounting positions, room dimensions, calculation surfaces and material reflectances.
The resulting model can assess:
- Average, minimum and maximum illuminance
- Uniformity across the calculation grid
- Horizontal and vertical illuminance
- Beam overlap and spacing
- Areas of excessive or insufficient light
- Lighting power and control strategies
- Glare or other project-specific performance criteria
The calculation is only as reliable as its inputs. Accurate dimensions, product files, mounting details, surface properties and maintenance assumptions are essential.
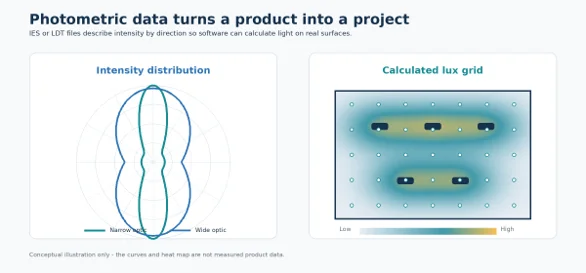 Figure 5. Conceptual polar distributions and a calculated lux grid illustrate how measured IES or LDT data connects a luminaire to the project model.
Measuring lux correctly on site
 Figure 6. Structured lux measurements at the correct task plane help verify a design during commissioning or a site audit.
A handheld lux meter is useful for commissioning, audits and fault-finding, but the measurement method matters.
Define the measurement plane
Measure at the height and orientation relevant to the task. A desk, floor, shelf face and vertical inspection surface are different calculation planes and will produce different readings.
Use a planned grid
A single bright point does not represent an entire area. Take measurements at consistent grid positions so that average, minimum, maximum and uniformity can be assessed where required.
Control the conditions
Record whether daylight, blinds, neighbouring luminaires or temporary obstructions affected the readings. Allow the lighting system to stabilise and use an appropriate, calibrated meter.
Compare like with like
Compare measured values with a calculation or requirement that uses the same plane, grid, operating condition and maintenance basis. Otherwise, the numbers may appear comparable while describing different conditions.
Common questions about lumens, candela and lux
Can lumens be converted directly to lux?
Only when the distribution of the incident light and the illuminated area are known. Dividing lumens by square metres is valid for uniform flux arriving on that defined surface; it does not predict a real installation without optical and geometric information.
How many lumens equal one candela?
There is no single conversion because one candela equals one lumen per steradian. The solid angle and distribution must be known. A perfectly uniform source producing 1 candela in every direction would emit 4 pi lumens, or approximately 12.57 lumens, over the full sphere. Real luminaires are rarely uniform in every direction.
Is 1,000 lux the same as 1,000 lumens?
No. A 1,000-lumen incident flux distributed uniformly over one square metre creates an average of 1,000 lux. Spread over ten square metres, it creates an average of 100 lux. A real luminaire may also send some of its output outside the target area.
Does higher candela mean a brighter fitting?
It means greater luminous intensity in the stated direction, not necessarily greater total output. Perceived brightness also depends on the apparent luminance of surfaces and sources, contrast, viewing direction and the observer’s adaptation.
Can a lux meter measure lumens?
Not directly from a single reading. A lux meter measures illuminance at its sensor. Estimating incident lumens requires measurements across a defined area and integration of the distribution; measuring a luminaire’s total output requires appropriate photometric equipment.
How to specify lighting more intelligently
1. Define the visual task
Identify what people need to see, where they need to see it and the level of risk or precision involved.
2. Set the relevant calculation surfaces
Confirm the height, orientation and extent of every important plane, including vertical surfaces where faces, shelves, signs, controls or hazards must be visible.
3. Select distribution before chasing output
Choose optics and beam patterns that place light where it is useful. More lumens cannot compensate efficiently for the wrong distribution.
4. Model the complete installation
Use verified photometric files in a project model that reflects the actual geometry, reflectances, mounting positions and maintenance assumptions.
5. Review the full quality picture
Illuminance must be considered together with uniformity, glare, colour temperature, colour rendering, flicker, controls, efficiency and the applicable project standards.
6. Commission and verify
Inspect the completed installation and take structured measurements where required. A good lighting design should work both in the calculation and in the real environment.
Better measurements lead to better lighting
Lumens, candela and lux are not competing ways to describe brightness. They answer different questions about the same system.
Lumens quantify the total visible output. Candela values reveal how strongly that output is directed. Lux values show how much light reaches the surfaces where people work, move, shop, learn or interact.
At LED Lighting SA, our lighting design and engineering teams use photometric data, 3D modelling and application knowledge to move beyond headline lumen values. We consider the complete journey of light – from the LED and optic to the architecture, task plane and people using the space.
Because successful lighting is not measured by how much light a fitting produces. It is measured by how effectively that light performs in the application.
Speak to the LED Lighting SA team about a photometric layout, product selection or project-specific lighting solution for your commercial, retail, industrial, hospitality, transport or specialist application.